-min.png)
-min.png)
Banking Sector Ratios: Understanding the Cost-to-Income Ratio
The cost-to-income ratio is one of the most vital metrics in banking, providing insight into a financial institution's efficiency. It serves as a key indicator of operational performance, giving both investors and regulators a clear view of how well a bank is managing its expenses in relation to its income. For those involved in financial analysis, portfolio management, or banking operations, grasping the cost-to-income ratio is essential to understanding a bank's profitability and long-term sustainability.
What Is the Cost-to-Income Ratio?
At its core, the cost-to-income ratio measures how much a bank spends to generate each unit of income. The formula is straightforward:

By calculating the cost-to-income ratio, stakeholders can evaluate how efficiently a bank operates. A lower ratio indicates better efficiency suggesting that the bank is able to convert its revenue into profits while controlling costs. On the other hand, a higher ratio signals higher operational expenses relative to income, which can raise red flags about inefficiency.
Importance of the Cost-to-Income Ratio in the Banking Sector
The cost-to-income ratio plays a crucial role in the banking industry, where high volumes of transactions and large operational infrastructures are involved. Banks, unlike many other industries, often operate on relatively slim margins, making it imperative for them to tightly manage costs. The cost-to-income ratio is a window into how effectively a bank’s management team is controlling costs relative to the revenue it generates.
Efficiency Measure: In the banking sector, where profit margins can be volatile due to regulatory pressures, interest rate fluctuations, and competitive factors, efficiency is everything. The cost-to-income ratio tells us how well a bank is optimizing its resources to stay competitive.
Investment Indicator: For investors, this ratio is an important tool in evaluating the future performance of a bank. A steady decrease in the cost-to-income ratio over time suggests that the bank is becoming more efficient, which can indicate stronger profitability and stability.
Regulatory Oversight: Regulators often keep a close eye on this ratio to ensure that a bank is not only profitable but also efficient. A high cost-to-income ratio could signal potential problems, including an inability to manage expenses effectively, which might require intervention.
Calculating the Cost-to-Income Ratio: Key Components
To fully understand the cost-to-income ratio, it's important to break down its components operating expenses and operating income.
Operating Expenses: These are the day-to-day costs associated with running a bank, excluding interest expenses. This includes employee salaries, rent, utilities, technology investments, administrative costs, and more. Managing operating expenses is key for banks to maintain a healthy ratio.
Operating Income: This is the total income generated from a bank’s normal business operations. It primarily includes net interest income (interest earned on loans minus interest paid on deposits) and non-interest income, such as fees and commissions. Increases in operating income naturally lead to a more favorable ratio.
For example, let’s say a bank has $1 billion in operating income and $600 million in operating expenses. Its cost-to-income ratio would be:
Cost-to-Income Ratio = (600 million / 1 billion) * 100 = 60%
This means that for every dollar of income, the bank is spending 60 cents on operating expenses.
Examples of Banks and Their Cost-to-Income Ratios: Breakdown & Analysis
1. JPMorgan Chase (USA)
Year: 2023
Operating Income: $151 billion
Operating Expenses: $69 billion
Cost-to-Income Ratio
Calculation:

Interpretation:
JPMorgan Chase has a cost-to-income ratio of 45.7%, which is quite strong compared to the banking industry average. The bank's massive scale and diversified revenue streams from investment banking, consumer banking, and wealth management enable it to operate efficiently. JPMorgan has invested heavily in digital transformation, cutting operational costs and boosting profitability. With a ratio well below 50%, this indicates robust operational efficiency.
2. HSBC Holdings (UK)
Year: 2023
Operating Income: $56.6 billion
Operating Expenses: $29.3 billion
Cost-to-Income Ratio
Calculation:

Interpretation:
HSBC’s cost-to-income ratio of 51.8% is within the healthy range, though not as low as some of its peers. As a global bank with a large presence in Asia, Europe, and the Americas, HSBC faces a higher cost base due to regulatory requirements and labor costs in multiple regions. The bank is undergoing a restructuring process, closing underperforming branches and investing in digital banking services to reduce future costs. The ratio suggests HSBC is managing its expenses reasonably well but still has room for improvement.
3. Deutsche Bank (Germany)
Year: 2023
Operating Income: €27.4 billion
Operating Expenses: €16.1 billion
Cost-to-Income Ratio
Calculation:

Interpretation:
Deutsche Bank’s cost-to-income ratio of 58.8% is higher than ideal, reflecting ongoing challenges in reducing costs. The bank has been in the midst of a major overhaul, including restructuring its investment banking division and reducing headcount. While the ratio is not alarming, it suggests that the bank is still working to improve its operational efficiency. Higher costs related to compliance, litigation, and restructuring efforts have contributed to its relatively high ratio, though progress has been made in recent years.
4. ICICI Bank (India)
Year: 2023
Operating Income: ₹1.07 trillion
Operating Expenses: ₹0.52 trillion
Cost-to-Income Ratio
Calculation:

Interpretation:
ICICI Bank has a cost-to-income ratio of 48.6%, a strong indicator of operational efficiency in a challenging and highly competitive market like India. The bank has focused heavily on digitization and expanding its retail banking operations, which has helped control costs. India’s banking sector is known for intense competition and high regulatory burdens, yet ICICI’s relatively low ratio suggests it is managing its expenses well. By continuing to invest in technology, the bank has successfully reduced costs while maintaining strong revenue growth.
5. Santander Group (Spain)
Year: 2023
Operating Income: €54.3 billion
Operating Expenses: €30.7 billion
Cost-to-Income Ratio
Calculation:

Interpretation:
Santander’s cost-to-income ratio of 56.5% is on the higher side, indicating that the bank is experiencing some challenges in managing costs. Santander is a global bank with operations across Europe, Latin America, and North America, meaning it faces different cost structures and regulatory environments in each region. Recent economic conditions in key markets such as Spain and Brazil have likely contributed to higher costs and lower revenue growth. Nevertheless, the bank’s efforts to digitize its operations and reduce branch networks should help lower the ratio over time.
What Is a Good Cost-to-Income Ratio in Banking?
While the cost-to-income ratio can vary widely between banks, sectors, and regions, a ratio between 50% to 60% is often considered healthy in the banking industry. A ratio below 50% is generally viewed as excellent, indicating high efficiency. Conversely, a ratio above 60% may indicate inefficiencies that could hurt profitability in the long run.
However, this range isn’t set in stone. Smaller banks, for instance, often have higher cost-to-income ratios because they don’t have the same economies of scale as larger institutions. Similarly, banks undergoing digital transformation may experience a temporary spike in this ratio as they invest heavily in technology and infrastructure to streamline future operations.
Factors Affecting the Cost-to-Income Ratio
There are various internal and external factors that can influence a bank’s cost-to-income ratio, including:
Technological Investments: With the banking sector rapidly embracing digital transformation, expenses related to IT infrastructure, cybersecurity, and online banking platforms have become significant. While these are upfront costs, they can reduce long-term operating expenses by automating processes and enhancing service delivery.
Interest Rate Environment: The interest rate climate has a direct impact on banks’ profitability. Lower interest rates reduce net interest income, shrinking operating income, which in turn increases the cost-to-income ratio.
Regulatory Changes: New regulatory requirements often lead to higher compliance costs, driving up operating expenses. For example, banks must frequently invest in new systems and processes to meet anti-money laundering (AML) and Know Your Customer (KYC) regulations.
Economic Conditions: A weak economy can reduce consumer and business demand for banking services, leading to lower operating income and potentially higher cost-to-income ratios. Similarly, an economic downturn can increase default rates on loans, further squeezing bank profits.
How Banks Can Improve Their Cost-to-Income Ratio
Cost Reduction Initiatives: Banks can look to cut costs by streamlining operations, reducing headcounts, and outsourcing non-core functions. Automation and digital transformation are key drivers in lowering operational costs, as they enable banks to reduce manual labor and improve service efficiency.
Revenue Generation: The other side of the equation is increasing income. Banks can focus on diversifying revenue streams by offering new products, expanding into underserved markets, or enhancing fee-based services.
Technology Adoption: Banks that invest in technology to automate operations often see significant improvements in their cost-to-income ratio. For instance, digital banking platforms reduce the need for physical branches, thereby cutting costs associated with real estate and staffing.
Mergers and Acquisitions: Consolidation within the banking sector often leads to improved economies of scale, which can help lower the cost-to-income ratio. By merging, banks can share resources, streamline operations, and reduce redundant expenses.
Comparing Cost-to-Income Ratios Across Banks
It's essential to note that the cost-to-income ratio can vary significantly based on a bank’s size, business model, and geographic location. Large, global banks typically have lower ratios because they benefit from economies of scale, while smaller, regional banks may have higher ratios due to higher relative costs.
For example:
Global Banks: Banks like JPMorgan Chase or HSBC may have a cost-to-income ratio around 50%, thanks to their massive scale and diversified income streams.
Regional Banks: Smaller regional banks may operate with ratios closer to 60-70%, as they have fewer resources to spread out fixed costs.
International Comparisons: European banks often report higher cost-to-income ratios than their American counterparts. This discrepancy arises from stricter regulations, higher labor costs, and economic conditions within the Eurozone. Meanwhile, banks in emerging markets may have even higher ratios due to underdeveloped infrastructure and higher operating risks.
The Role of Technology in Improving Efficiency
As the banking industry continues to evolve, technology is playing an increasingly important role in improving efficiency and lowering the cost-to-income ratio. Automation, artificial intelligence, and machine learning have revolutionized processes such as loan approvals, fraud detection, and customer service, all of which contribute to reducing operational expenses.
Many banks are adopting digital-only banking models, which operate with significantly lower overhead costs. By eliminating the need for physical branches and embracing mobile platforms, these banks are able to deliver services at a fraction of the cost compared to traditional institutions. This has a direct and profound impact on their cost-to-income ratio, making them more competitive in an increasingly digital world.
Cost-to-Income Ratio vs Other Banking Metrics: A Comprehensive Comparison
Cost-to-Income Ratio vs Return on Assets (ROA)
Cost-to-Income Ratio: Measures operational efficiency, focusing on how well the bank manages its expenses in relation to income.
Return on Assets (ROA): Measures overall profitability by showing how effectively a bank uses its assets to generate profit.
ROA Formula:

Key Differences:
Cost-to-Income Ratio focuses purely on operational efficiency (expenses vs. income), ignoring how well the bank is using its assets.
ROA is a profitability metric that evaluates how effectively the bank’s total asset base (loans, investments, etc.) is generating profit. A higher ROA means the bank is better at turning its assets into net income.
Example Interpretation:A bank could have a low cost-to-income ratio, suggesting strong operational efficiency, but a low ROA might indicate that the bank is not using its assets effectively. Conversely, a bank with a high ROA and a moderate cost-to-income ratio could indicate that, while expenses are relatively high, the bank is still very profitable.
2. Cost-to-Income Ratio vs Net Interest Margin (NIM)
Cost-to-Income Ratio: Shows how efficiently a bank controls costs relative to income.
Net Interest Margin (NIM): Measures the difference between the interest income generated by banks and the amount of interest paid out to lenders (e.g., deposits).
NIM Formula:

Key Differences:
Cost-to-Income Ratio reflects the overall efficiency in managing operational costs but doesn't differentiate between different sources of income (interest vs. non-interest income).
NIM focuses solely on interest-generating activities, making it a critical metric for banks that primarily operate as lending institutions.
Example Interpretation:A bank with a low cost-to-income ratio and a high NIM is well-positioned in both cost efficiency and interest-generating activities. However, a bank with a low NIM but a good cost-to-income ratio might suggest that while the bank is controlling costs, its core lending activities are less profitable than competitors.
3. Cost-to-Income Ratio vs Return on Equity (ROE)
Cost-to-Income Ratio: Measures operational cost control.
Return on Equity (ROE): Assesses the profitability of a bank in generating profits from shareholders' equity.
ROE Formula:

Key Differences:
Cost-to-Income Ratio gives insight into how efficiently a bank manages operational costs but does not speak to the value created for shareholders.
ROE directly measures how well a bank is generating returns for its shareholders. A high ROE indicates strong profitability relative to the equity held by shareholders.
Example Interpretation:A bank with a low cost-to-income ratio and a high ROE demonstrates both operational efficiency and strong profitability for shareholders. However, if a bank has a good cost-to-income ratio but low ROE, it could suggest that while it’s controlling costs, it is not delivering enough profit to equity holders, possibly due to low revenue or poor investment returns.
4. Cost-to-Income Ratio vs Efficiency Ratio
Cost-to-Income Ratio: Measures operational expenses against operating income, specific to banking and financial institutions.
Efficiency Ratio: While similar to the cost-to-income ratio, the efficiency ratio is often used more broadly across industries. For banks, these terms are often used interchangeably.
Efficiency Ratio Formula:
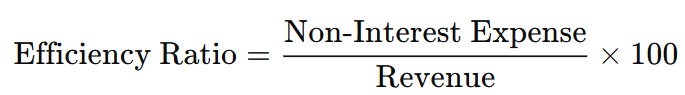
Key Differences:
In banking, cost-to-income ratio and efficiency ratio are often synonymous, but efficiency ratio in other industries may include or exclude different categories of expenses and income.
The cost-to-income ratio is more standardized in the banking sector to reflect a bank’s operational efficiency, while the efficiency ratio is a more generalized term used across various industries to assess operational effectiveness.
Example Interpretation:Both ratios essentially provide the same interpretation within the banking sector: a lower percentage indicates a more efficiently run operation.
5. Cost-to-Income Ratio vs Capital Adequacy Ratio (CAR)
Cost-to-Income Ratio: Focuses on operational efficiency.
Capital Adequacy Ratio (CAR): Measures a bank's financial stability and its ability to absorb potential losses, ensuring the institution can remain solvent during financial difficulties.
CAR Formula:

Key Differences:
Cost-to-Income Ratio is an operational metric, focusing on costs and income but ignoring capital structure.
CAR is a risk and solvency measure, ensuring that the bank has enough capital relative to its risk-weighted assets. It ensures that the bank can survive financial shocks.
Example Interpretation:A bank could have a great cost-to-income ratio, signaling efficiency, but if its CAR is low, the bank might not have enough capital to withstand a downturn or absorb losses. On the other hand, a bank with a high CAR and a reasonable cost-to-income ratio would be seen as both efficient and well-capitalized, which reassures regulators and investors.
Side-by-Side Comparison
Metric | Purpose | Formula | Ideal Range |
Cost-to-Income Ratio | Measures operational efficiency | Operating Expenses / Operating Income * 100 | 50% – 60% |
ROA | Measures profitability from total assets | Net Income / Total Assets * 100 | 1% – 2% |
NIM | Measures profitability from interest activities | Net Interest Income / Average Earning Assets * 100 | 2% – 4% |
ROE | Measures profitability for shareholders | Net Income / Shareholders' Equity * 100 | 10% – 15% |
CAR | Measures financial stability and risk | (Tier 1 Capital + Tier 2 Capital) / Risk-Weighted Assets * 100 |
Comments