-min.png)
-min.png)
Net Interest Margin (NIM)
- Analyst Interview
- Oct 11, 2024
- 12 min read
Updated: Jan 4
Understanding Net Interest Margin (NIM): A Crucial Banking Ratio
Net Interest Margin (NIM) is a vital indicator of a bank’s profitability. In simple terms, NIM represents the difference between the interest income a bank earns on loans and the interest it pays on deposits, expressed as a percentage of its interest-earning assets. This ratio is often used to evaluate how effectively a bank is managing its core business lending and borrowing.
Banks play a critical role in the economy, and their ability to remain profitable depends largely on how efficiently they manage their lending and borrowing operations. In this article, we’ll dive deep into the concept of NIM, its calculation, its significance in banking, and how it impacts both financial institutions and their customers.
What is Net Interest Margin (NIM)?
At its core, Net Interest Margin (NIM) is a measure of the difference between the interest a bank earns on its assets, typically loans and securities, and the interest it pays out to depositors and other funding sources. NIM is expressed as a percentage and provides insight into a bank’s profitability from its primary business of lending.
The formula for calculating NIM is:

In this formula:
Interest income includes all the interest the bank earns from loans, bonds, and other interest-earning assets.
Interest expenses refer to the interest the bank pays to its depositors and other creditors.
Average interest-earning assets are the average amount of assets, such as loans or securities, that generate interest income for the bank over a specific period.
By calculating NIM, banks can assess how well they are utilizing their resources to generate profit.
Why is Net Interest Margin Important?
NIM is crucial for several reasons. Firstly, it is an indicator of a bank's ability to lend profitably. If the NIM is high, it suggests that the bank is earning more from its loans than it is paying out on its deposits. This is a clear sign of efficient asset management and good health.
Secondly, NIM affects the bank’s overall profitability. Banks with a consistently high NIM can sustain their operations better during economic downturns because they have a solid income stream from their lending activities. Conversely, a declining NIM can signal that a bank is under pressure, possibly because it is paying too much interest to depositors or is unable to charge high enough interest rates on loans.
Lastly, for investors and analysts, NIM is a key metric for comparing banks. It offers a quick snapshot of how efficiently a bank is managing its lending and borrowing activities, which in turn impacts its stock price and valuation.
Factors Affecting Net Interest Margin (NIM)
Several factors can influence a bank’s NIM, many of which are tied to broader economic conditions, as well as the bank’s internal strategies. Some of the most significant factors include:
Interest Rate Environment: Changes in interest rates, driven by central banks or market conditions, have a direct impact on NIM. For instance, in a rising interest rate environment, banks can charge higher interest on loans, potentially increasing NIM. However, if the rates paid to depositors rise faster than the rates on loans, NIM may shrink.
Loan Demand and Credit Quality: If demand for loans increases, banks can lend more and potentially improve their NIM. However, if the quality of the borrowers declines, banks might need to set aside more provisions for bad loans, reducing profitability and impacting NIM.
Competition: Intense competition in the banking sector can compress NIM. If banks have to lower loan rates to attract borrowers or increase deposit rates to attract funds, their margin may decrease.
Cost of Funds: The cost that banks incur to attract and retain deposits, also known as the cost of funds, can significantly influence NIM. A bank that can keep its deposit costs low while maintaining or increasing its loan rates will have a higher NIM.
Asset Mix: The types of loans and securities a bank holds also affect its NIM. For example, long-term, fixed-rate loans may have different margins than short-term, variable-rate loans. The more a bank can optimize its asset mix to balance risk and return, the better its NIM.
How to Calculate NIM (Examples)
Let’s walk through an example of calculating NIM. Suppose a bank earns $10 million in interest income from its loans and securities and pays $4 million in interest to depositors. If the bank's average interest-earning assets amount to $200 million, the NIM would be calculated as follows:

This means the bank earns a 3% return on its interest-earning assets, which is a decent indicator of profitability.
Examples of Net Interest Margin (NIM)
1. JPMorgan Chase (Q3 2023)
JPMorgan Chase, one of the largest banks globally, reported a NIM of 2.45% in Q3 2023. This represents a significant rise from prior periods, driven by higher interest rates and loan growth.
Steps to Calculate JPMorgan's NIM:
Interest Income (from loans and securities): $80 billion
Interest Expenses (on deposits and borrowings): $30 billion
Average Interest-Earning Assets: $2 trillion
NIM Calculation:

Explanation: JPMorgan's increased NIM reflects the bank's ability to capitalize on rising interest rates while keeping deposit costs relatively stable. This results in better profitability from its lending operations.
2. Bank of America (Q2 2023)
Bank of America posted a NIM of 2.33% in Q2 2023, up slightly from previous quarters. Like many banks, it benefited from a favorable interest rate environment.
Steps to Calculate Bank of America's NIM:
Interest Income: $60 billion
Interest Expenses: $22 billion
Average Interest-Earning Assets: $1.625 trillion
NIM Calculation:

Explanation: Bank of America's improvement in NIM reflects strategic adjustments to its loan portfolio and careful management of funding costs, despite increasing competition for deposits.
3. Citigroup (Q3 2023)
Citigroup’s NIM for Q3 2023 was 2.15%, which indicates the pressure that global banks are experiencing due to rising interest costs.
Steps to Calculate Citigroup's NIM:
Interest Income: $40 billion
Interest Expenses: $18 billion
Average Interest-Earning Assets: $1.02 trillion
NIM Calculation:

Explanation: Citigroup’s NIM reflects tighter margins due to increased interest costs on deposits and debt securities. Their NIM struggles, similar to other banks, under the competitive pressure of higher deposit rates.
4. Wells Fargo (Q3 2023)
Wells Fargo reported a NIM of 3.18% in Q3 2023, one of the higher margins among major U.S. banks. The bank leveraged rising loan rates while maintaining a relatively low cost of deposits.
Steps to Calculate Wells Fargo's NIM:
Interest Income: $50 billion
Interest Expenses: $15 billion
Average Interest-Earning Assets: $1.1 trillion
NIM Calculation:

Explanation: Wells Fargo’s strategy of focusing on higher-yielding loans, combined with efforts to control deposit costs, resulted in a robust NIM. This shows strong profitability from their core lending activities.
5. U.S. Bancorp (Q2 2023)
U.S. Bancorp reported a NIM of 2.90% for Q2 2023. While still healthy, the bank has faced pressures from increasing deposit costs.
Steps to Calculate U.S. Bancorp's NIM:
Interest Income: $12 billion
Interest Expenses: $4.5 billion
Average Interest-Earning Assets: $570 billion
NIM Calculation:

Explanation: U.S. Bancorp’s NIM indicates steady income from loans relative to their deposit costs. Despite pressures on the interest expense side, the bank has maintained solid profitability from its lending activities.
The Relationship Between NIM and Bank Profitability
NIM is closely tied to a bank’s profitability because it directly affects the revenue generated from its core operations. Banks primarily make money by lending at a higher interest rate than they pay on deposits. Therefore, a higher NIM generally indicates better profitability.
However, banks also face challenges in maintaining a high NIM. For example, during periods of low interest rates, banks may struggle to maintain their margins because they cannot reduce the interest paid to depositors below a certain point, even as loan rates fall.
Additionally, as the economy evolves, banks may face shifts in customer behavior, regulations, and market dynamics, all of which can impact NIM. For instance, changes in regulatory frameworks, such as the introduction of new capital requirements, can constrain a bank’s ability to lend, which in turn can squeeze its NIM.
NIM and Economic Cycles
It’s essential to understand how economic cycles impact NIM. During periods of economic expansion, banks typically see higher demand for loans, which can lead to an increase in NIM. As businesses and individuals take on more debt to finance growth, banks have more opportunities to earn interest income.
However, during economic downturns, loan demand often drops, and banks may also face higher default rates on existing loans, which can lower their NIM. Moreover, central banks often reduce interest rates during recessions to stimulate the economy, further compressing NIM.
In this context, banks must carefully manage their balance sheets and lending strategies to protect their NIM throughout various stages of the economic cycle.
Strategies Banks Use to Improve NIM
Given the importance of NIM to a bank’s profitability, many banks employ specific strategies to maintain or improve their margins. Some of the most common strategies include:
Loan Repricing: Banks can adjust their loan interest rates more frequently, especially in a rising rate environment, to ensure they capture the benefits of higher market rates.
Managing Deposit Costs: By offering tiered interest rates based on account balances or locking in deposits at favorable rates during low-rate periods, banks can control the interest expenses on deposits.
Diversifying Revenue Streams: Some banks diversify their income sources by focusing on non-interest income, such as fees and commissions from other banking services. This can help to stabilize income and mitigate the impact of a declining NIM.
Hedging Interest Rate Risk: Some banks use financial instruments, such as interest rate swaps, to hedge against fluctuations in interest rates, helping to smooth out NIM over time.
The Role of NIM in Financial Analysis
For investors and financial analysts, NIM is an important tool for evaluating the performance and efficiency of banks. A consistently high NIM can indicate that a bank has strong pricing power and is managing its funding costs well. On the other hand, a declining NIM may signal that a bank is facing increased competition or is struggling to manage its costs.
When analyzing NIM, it’s also essential to consider it in the context of other financial ratios. For example, a high NIM combined with a low cost-to-income ratio suggests that a bank is both profitable and efficient.
Net Interest Margin (NIM) vs. Other Metrics:
Net Interest Margin (NIM) vs. Return on Assets (ROA)
Return on Assets (ROA) is another widely used metric in banking, but it differs from NIM in that it measures a bank’s overall profitability rather than just the profitability of its lending activities. ROA is calculated by dividing a bank’s net income by its total assets and is expressed as a percentage. The formula for ROA is:

Key Differences:
Scope: While NIM focuses solely on the profitability of interest-bearing assets, ROA takes into account all of a bank’s assets, including non-interest income such as fees and commissions.
Profitability Indicator: ROA is a broader measure of profitability, capturing not just how well a bank manages its loans and deposits, but also how efficiently it uses all of its resources to generate income. NIM is more narrowly focused on interest-related activities.
Interpretation: A higher ROA indicates better overall asset utilization and profitability, whereas a higher NIM suggests the bank is earning more from its lending activities relative to its borrowing costs.
In practice, banks with high NIM may also have strong ROA, but not necessarily. A bank with a low NIM might compensate with high fee-based income, boosting its ROA.
Pros and Cons of ROA vs. NIM:
ROA offers a more comprehensive look at the bank’s profitability but can be skewed by non-operating income.
NIM provides a focused lens on core lending activities, making it useful for comparing banks that primarily earn from interest-related operations.
Net Interest Margin (NIM) vs. Return on Equity (ROE)
Return on Equity (ROE) is another critical profitability metric that measures how effectively a bank uses its shareholders’ equity to generate profit. It is calculated as:

Key Differences:
Profit vs. Lending Efficiency: While NIM evaluates lending profitability, ROE focuses on the profitability derived from the bank’s equity base. NIM reflects the bank’s ability to profit from lending, while ROE shows how well the bank is using its shareholders’ investments to generate overall profit.
Stakeholder Focus: ROE is often of primary interest to investors, as it indicates how much return they are getting on their investment. NIM, on the other hand, is more useful for analyzing operational efficiency in the bank's lending and borrowing activities.
Pros and Cons of ROE vs. NIM:
ROE is a valuable measure of shareholder value creation but can be influenced by factors like leverage and capital structure.
NIM provides insight into the operational side of banking and is more tied to the day-to-day business of managing loans and deposits.
While both metrics are essential, NIM helps to explain how efficiently a bank is generating its primary source of income, whereas ROE tells a more comprehensive story about profitability from an investor’s perspective.
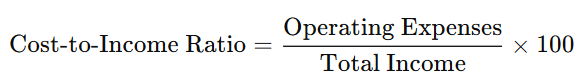
Net Interest Margin (NIM) vs. Cost-to-Income Ratio
The Cost-to-Income Ratio is a crucial efficiency metric used to assess a bank’s operating efficiency. It is calculated as:
Key Differences:
Efficiency vs. Profitability: The Cost-to-Income Ratio focuses on the bank’s operational efficiency—how much it costs the bank to generate each dollar of income. NIM, on the other hand, is a measure of profitability in the bank’s core lending activities.
Inverse Relationship: In general, a lower cost-to-income ratio indicates greater efficiency, while a higher NIM suggests greater profitability. A bank can have a high NIM but also high operating expenses, which would result in a less favorable cost-to-income ratio.
Pros and Cons of Cost-to-Income Ratio vs. NIM:
Cost-to-Income Ratio offers insights into a bank’s overall operational efficiency but does not provide information about the specific profitability of interest-earning activities.
NIM highlights profitability from lending, but it doesn’t account for the bank’s cost structure or efficiency.
Both metrics are vital for understanding different aspects of a bank’s performance. NIM gives a direct view of profitability from interest-related activities, while the Cost-to-Income Ratio sheds light on how well the bank controls its operating expenses relative to income.
Net Interest Margin (NIM) vs. Loan-to-Deposit Ratio (LDR)
The Loan-to-Deposit Ratio (LDR) measures the ratio of a bank’s total loans to its total deposits. It is calculated as:

Key Differences:
Lending Focus: The LDR provides insight into how effectively a bank is using its deposits to fund loans. A higher LDR indicates that a bank is lending out more of its deposits, while a lower LDR suggests that the bank may have excess liquidity. NIM, however, is focused on the profitability of those loans rather than the proportion of deposits used.
Asset-Liability Management: NIM looks at profitability on interest-bearing assets, while LDR provides insight into the balance between a bank’s lending and deposit-taking activities.
Pros and Cons of LDR vs. NIM:
LDR can be useful for evaluating the liquidity and lending strategy of a bank, but it doesn’t tell you whether the loans are profitable or not, which is where NIM comes in.
NIM provides a clear view of how profitably the bank is managing its interest-earning assets.
Net Interest Margin (NIM) vs. Net Interest Spread
Net Interest Spread is another metric closely related to NIM. It measures the difference between the average interest rate earned on interest-bearing assets (like loans) and the average interest rate paid on interest-bearing liabilities (like deposits). Unlike NIM, it does not take the size of the bank’s assets into account.

Key Differences:
Calculation Basis: Net Interest Spread focuses only on the interest rate differential, while NIM takes into account both the rate differential and the size of the bank’s interest-earning assets.
Granularity: NIM provides a more comprehensive view of profitability because it factors in the volume of assets, whereas the Net Interest Spread gives a more granular view of how interest rates affect profitability.
Pros and Cons of Net Interest Spread vs. NIM:
Net Interest Spread can provide a clearer picture of rate dynamics, but it lacks the asset context that makes NIM a more holistic profitability measure.
NIM is generally seen as the superior metric for assessing overall interest profitability, particularly for larger or more complex banks.
FAQs
What is the ideal Net Interest Margin for a bank?
While there is no set ideal NIM, a range of 2-4% is often considered healthy for most banks. However, the ideal margin varies based on the bank’s size, business model, and the economic environment.
How does inflation affect NIM?
Inflation can lead to rising interest rates, which may increase NIM if banks can charge higher rates on loans. However, if deposit costs rise too quickly, NIM could be squeezed.
Can a negative NIM occur?
Yes, a negative NIM can occur if a bank pays more in interest on deposits and other funding than it earns on loans and securities. This situation is rare but possible in extreme market conditions.
How do central bank policies influence NIM?
Central banks influence interest rates through monetary policy. Lowering interest rates can compress NIM, while raising rates can expand NIM if banks can adjust loan rates quickly.
How can banks protect their NIM during an economic downturn?
Banks can use strategies such as diversifying income sources, managing deposit costs, and hedging against interest rate changes to protect their NIM during downturns.
Is NIM the same for all types of banks?
No, NIM can vary significantly depending on the type of bank. For example, commercial banks that focus on lending may have a higher NIM than investment banks, which earn more from fees and commissions.
Conclusion
Net Interest Margin (NIM) is a critical financial ratio that provides deep insights into a bank's profitability, efficiency, and overall health. By understanding how NIM is calculated and the factors that influence it, financial institutions can better manage their assets, while investors and analysts can make more informed decisions.
Banks that successfully manage their NIM tend to have stronger balance sheets, better profitability, and more resilience during economic cycles. As such, keeping a close eye on NIM should be a priority for anyone involved in the banking industry.
Comments